Monitor Servers.
From Above.
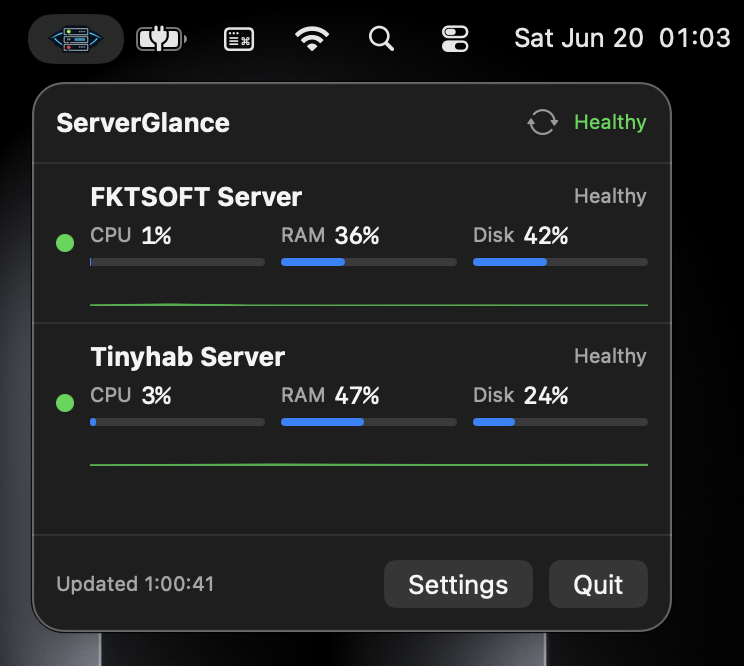
The lightweight menu bar companion for Dokploy, Coolify, and self-hosted infrastructure. Real-time CPU, RAM, and disk metrics with sparkline history — all via secure SSH.
// Screenshots
See It In Action
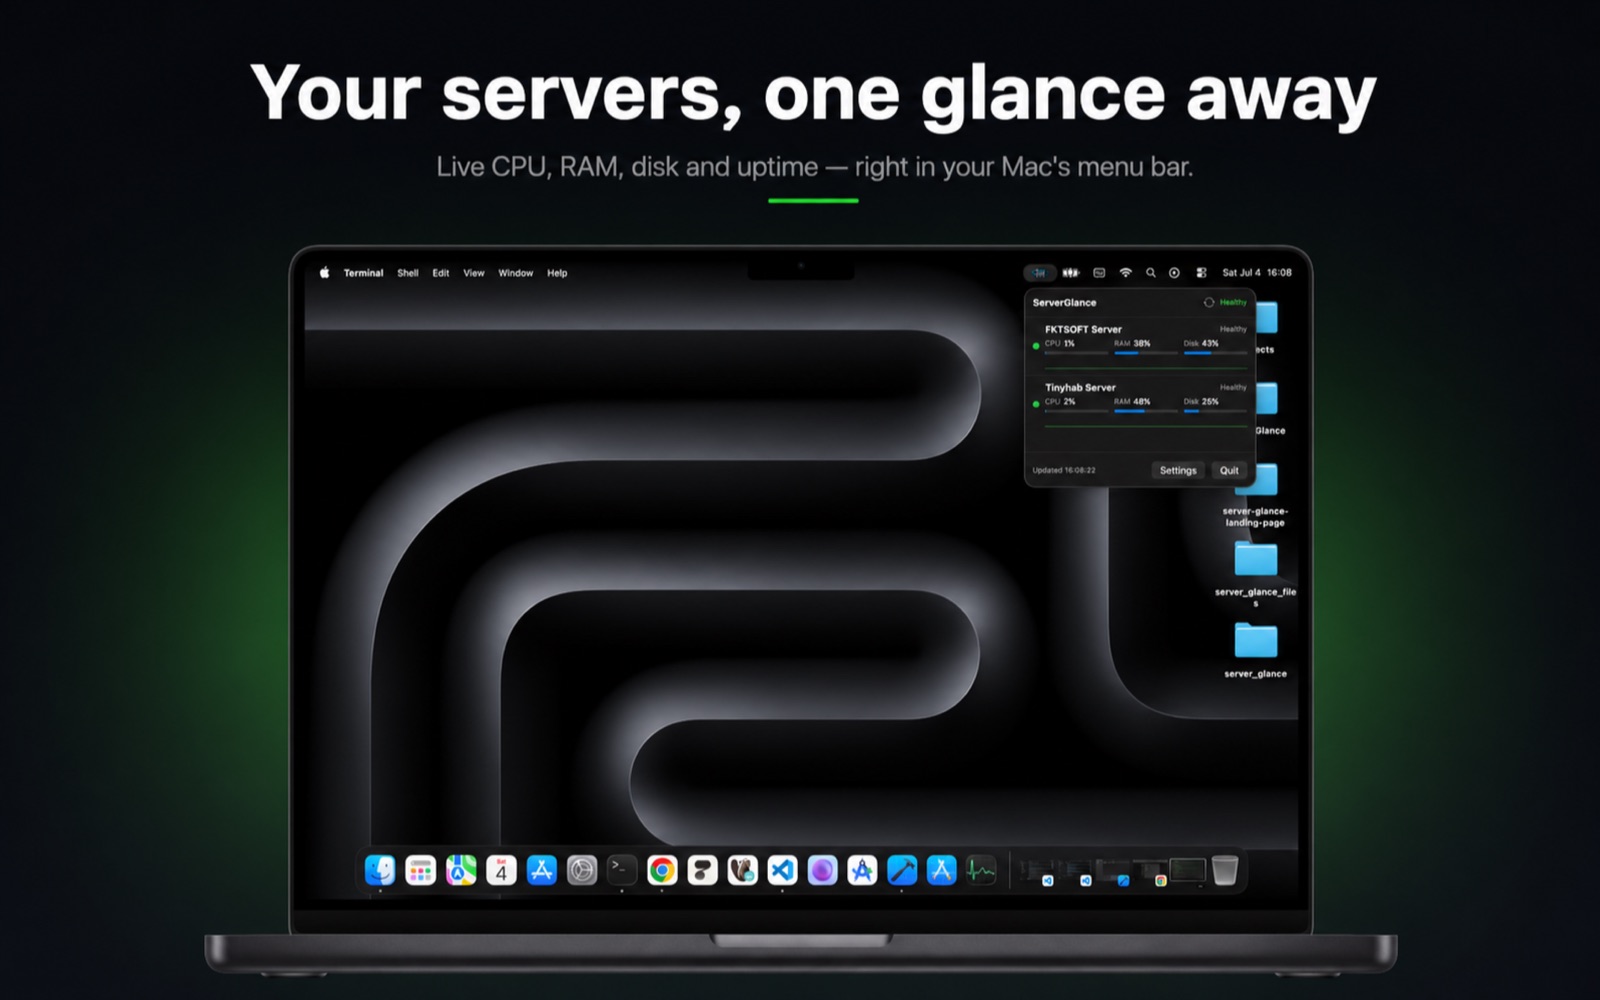
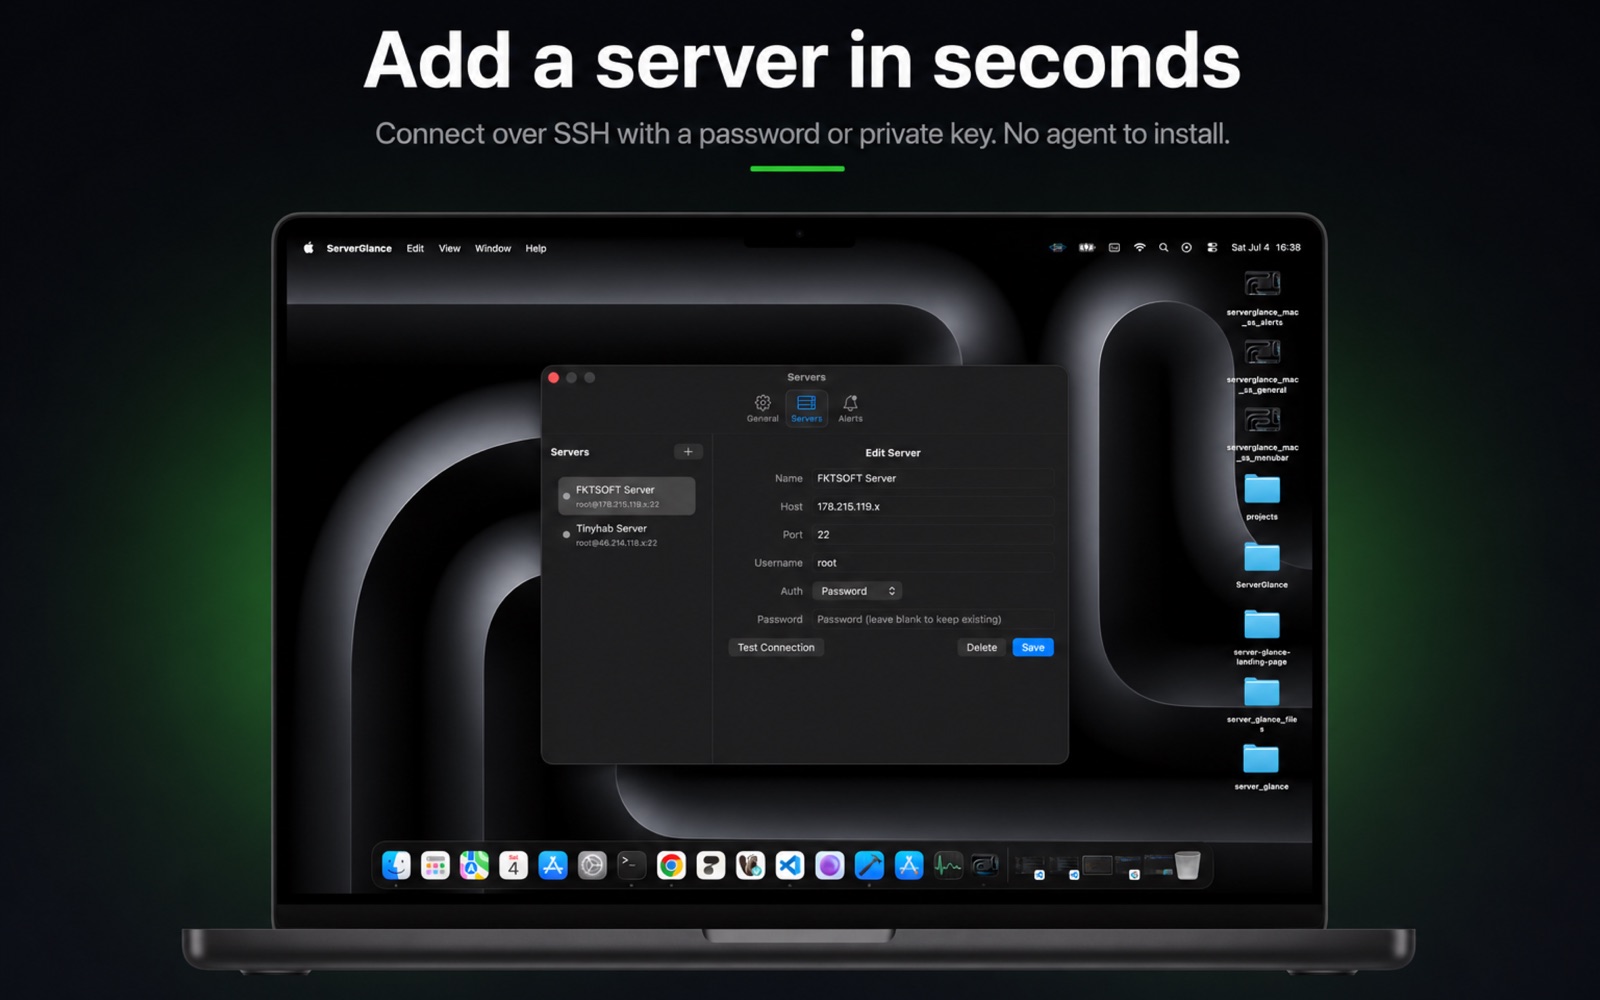
Live metrics, smart alerts, and native settings — right from your Mac's menu bar.
Drag to explore
// Native_macOS
Built for the Menu Bar
Ultra-Lightweight
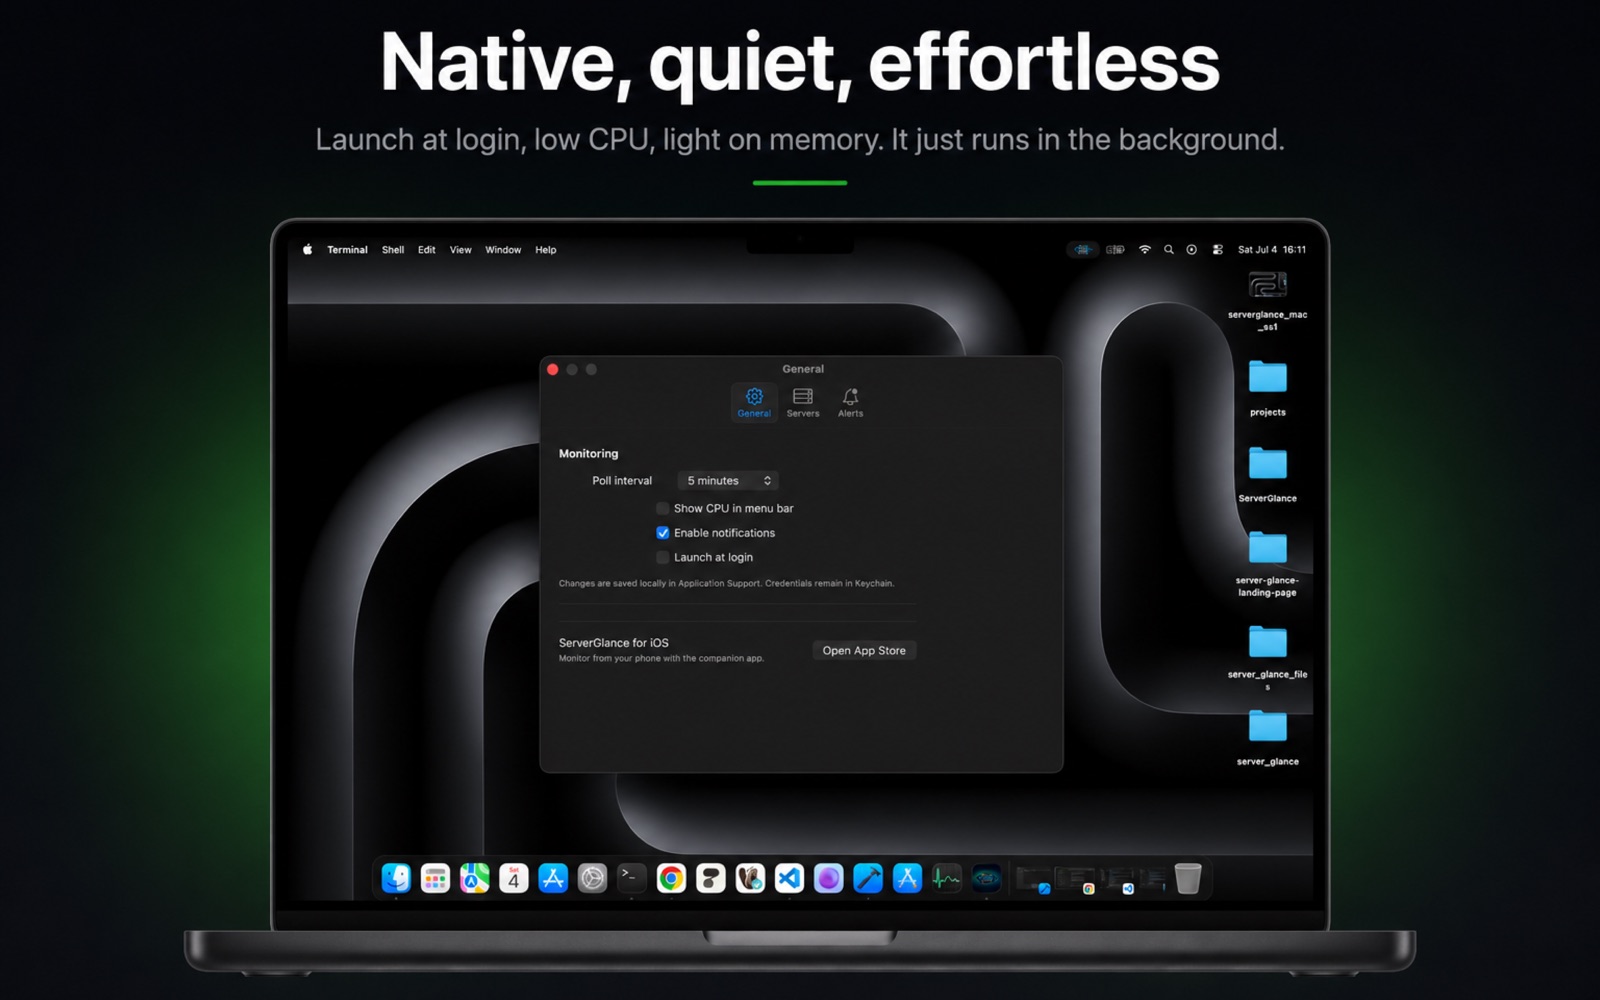
Under 25MB memory footprint. Zero CPU impact. Runs silently in your menu bar without slowing down your Mac.
SSH-Only Security
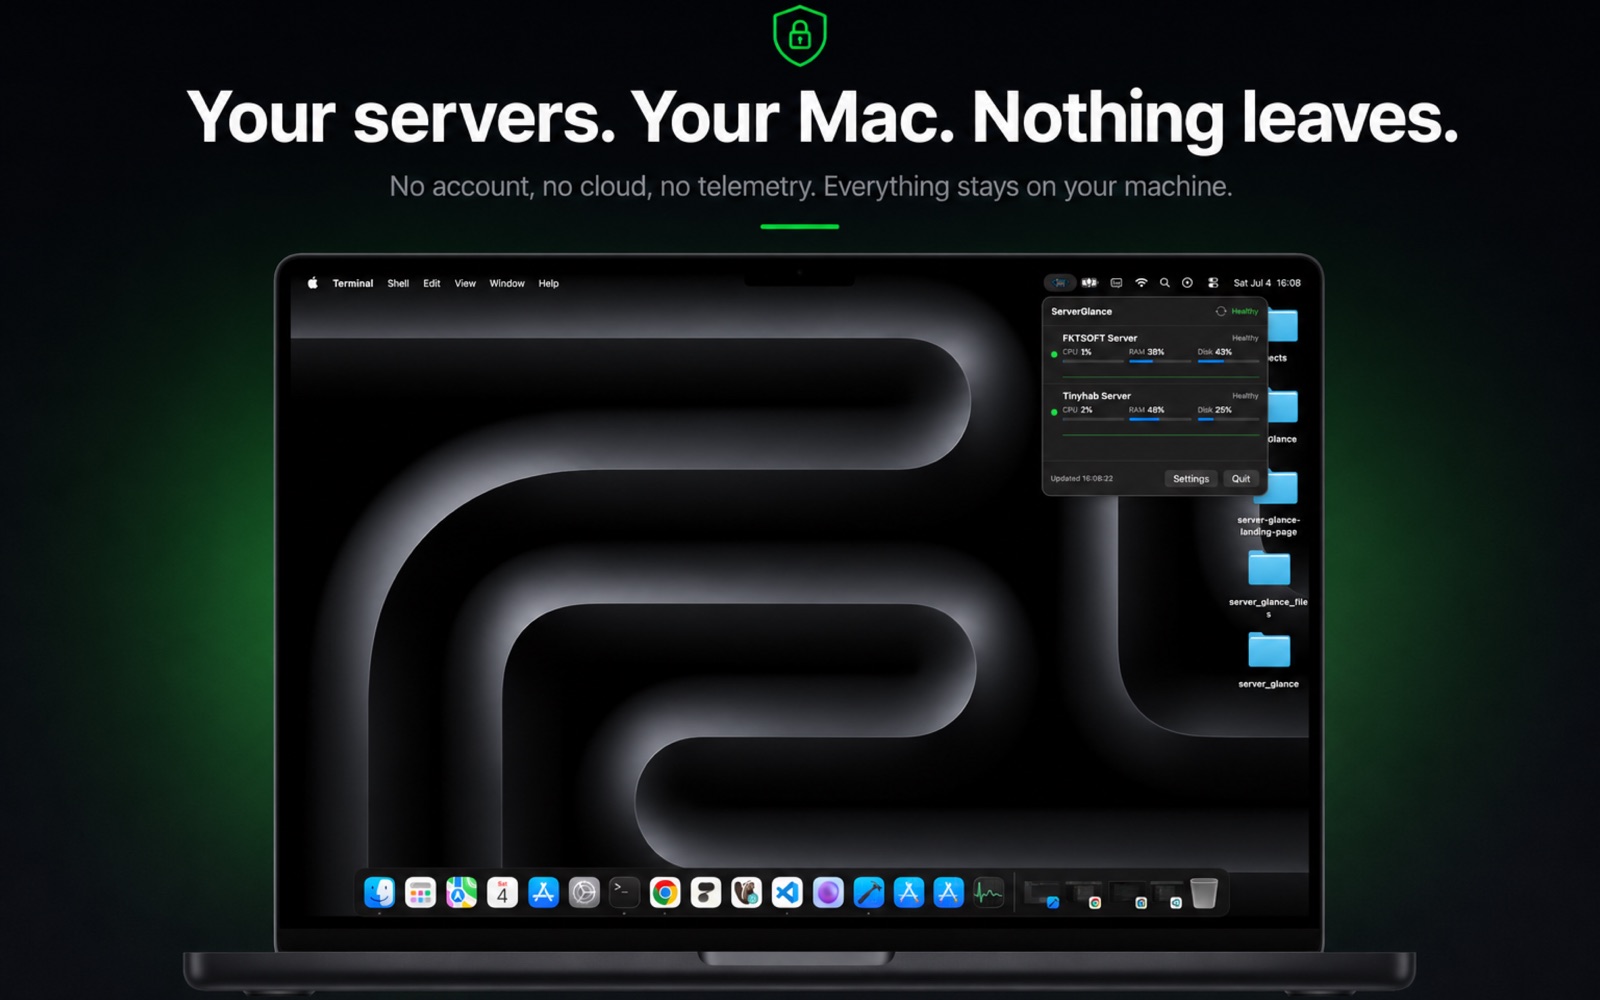
Direct SSH connections to your servers. Passwords stored in Keychain. No cloud middleman, no data collection.
Smart Alerts
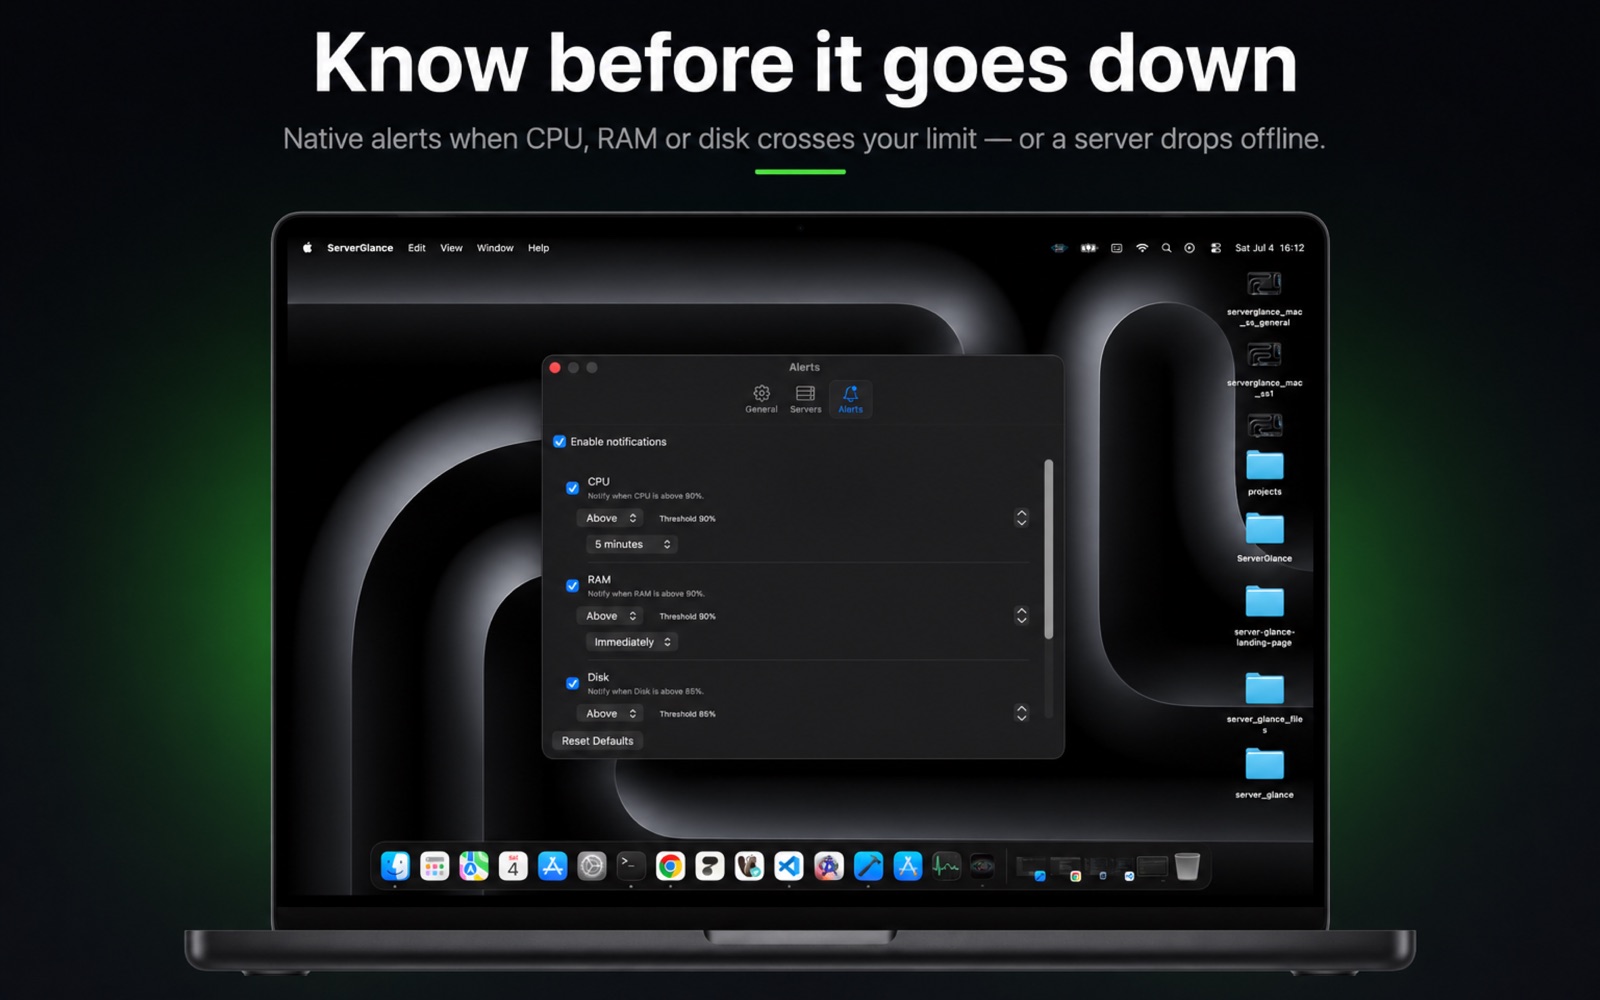
Native macOS notifications when CPU, RAM, or disk crosses your thresholds. Configurable silence windows.
Auto-Updates
Sparkle-powered automatic updates. Always stay on the latest version without manual downloads.
// Native_Settings
macOS Native Settings
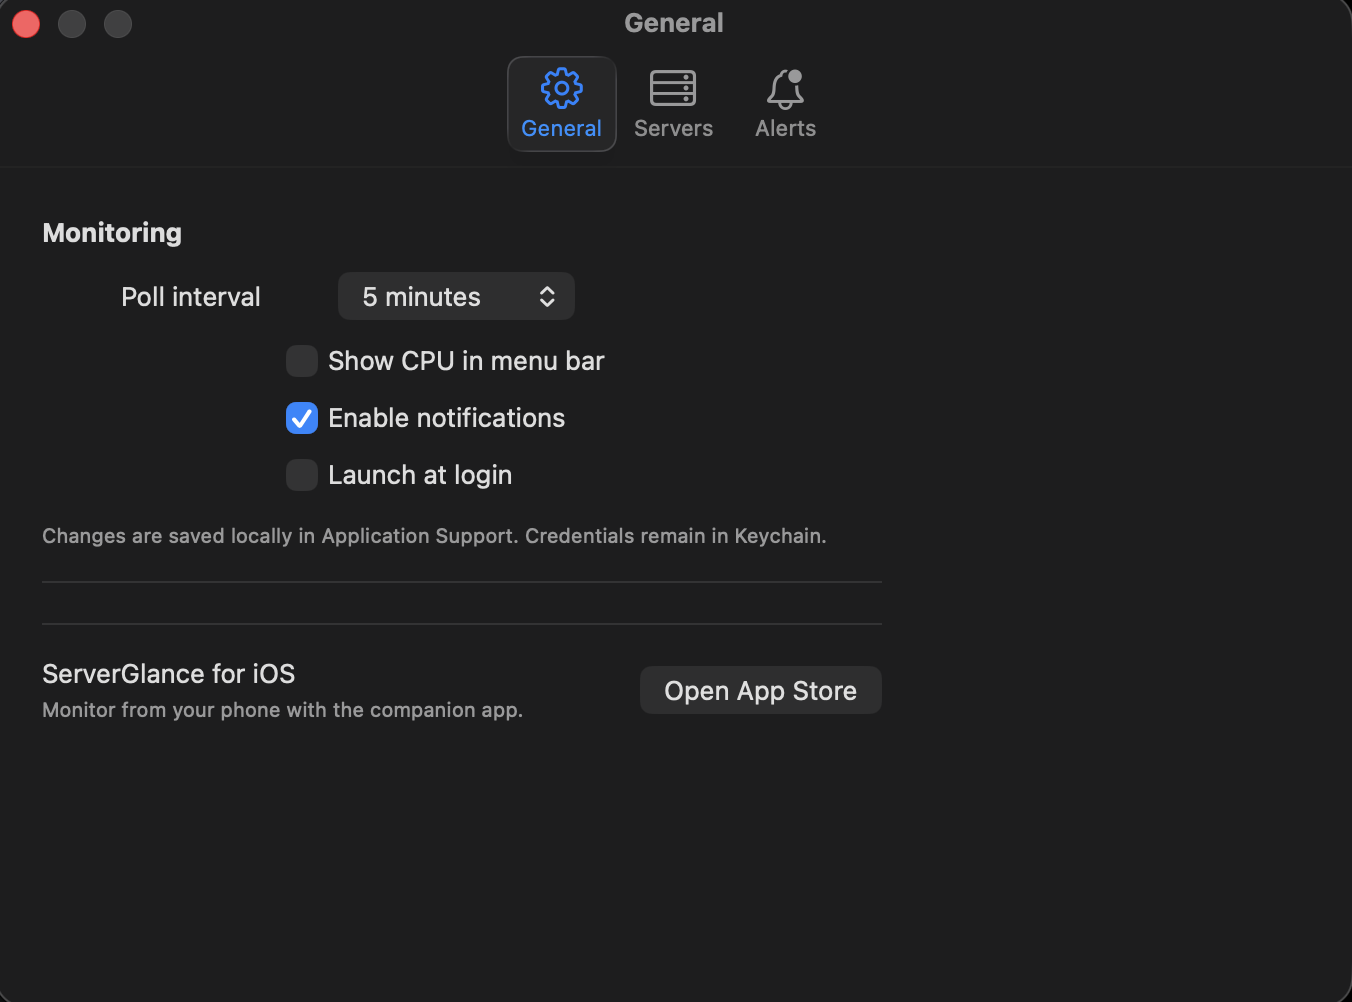
General
Poll interval, menu bar CPU, notifications, launch at login
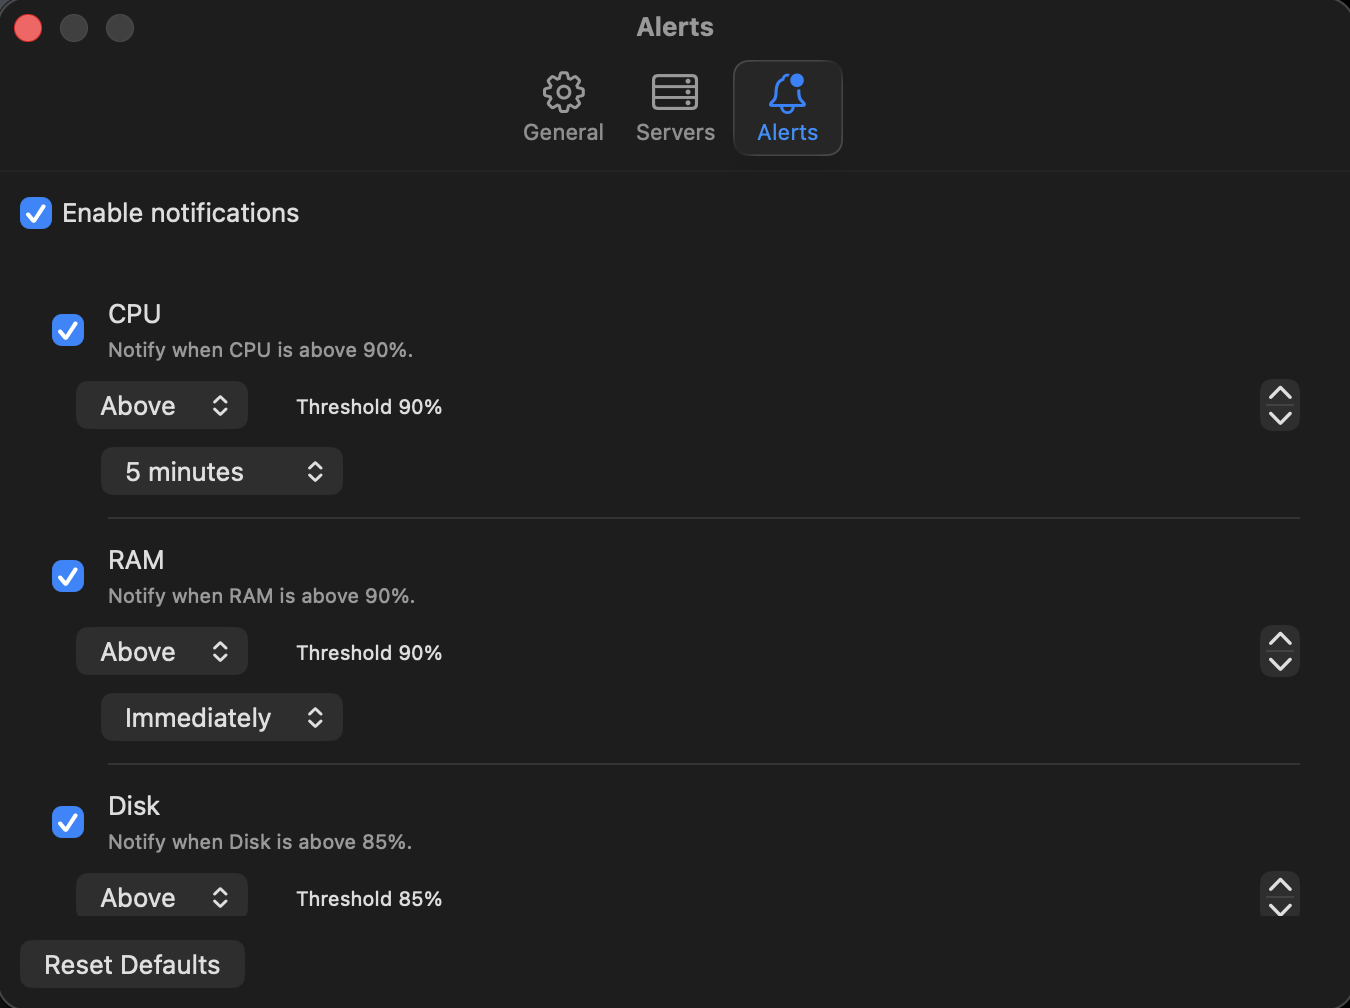
Alerts
Configurable thresholds for CPU, RAM, and disk with duration windows
// Quick_Start
3 Steps to Monitor
Download & Install
Drag ServerGlance.app to Applications. Launch from menu bar.
Add Your Servers
Enter host, user, and SSH credentials. Test connection with one click.
Monitor & Relax
ServerGlance polls in the background. Get notified when things go wrong.
// Perfect_For
Your Stack, Monitored
ServerGlance doesn't care what's running on top — it watches the Linux box underneath over plain SSH.
Dokploy
Dokploy's dashboard has the numbers, but you have to go open it. ServerGlance keeps CPU, RAM, and disk for the same host visible in your menu bar, all the time.
Coolify
Coolify's dashboard shows host metrics too — ServerGlance just puts them one glance away, live in your menu bar, without opening a browser tab.
Self-Hosted
Docker Compose stacks, reverse proxies, home lab boxes — any Linux server you SSH into. Nothing extra to install or run on the box itself.
VPS Fleet
DigitalOcean droplet, Hetzner box, a spare Linode — different providers, one menu bar, so you stop tab-hopping between dashboards to check load.
// Built_Different
Not Another Cloud Dashboard
Most server monitoring tools want an agent on your box and your metrics in their cloud. ServerGlance is a native SSH client that happens to draw graphs — nothing runs on your server, nothing passes through ours.
- Agent daemon installed and running on every server
- Metrics routed through a vendor-run cloud backend
- Account and login required to see your own servers
- Monthly subscription that grows with server count
- Nothing to install — reads metrics over the SSH session itself
- Direct SSH, Mac to server — no relay, no middleman
- No account, no login — credentials stay in macOS Keychain
- $19.99 once, unlimited servers, no subscription
// Pricing
Start Free. Pay Once.
Monitor up to 2 servers for free. Unlock unlimited with a single purchase — no subscription, ever.
- Up to 2 servers
- Real-time CPU, RAM, disk metrics
- CPU sparkline history (60 min)
- Native alerts & SSH key auth
- Everything in Free
- Unlimited servers
- Free updates via App Store
- No subscription, ever
Unlock via in-app purchase. No subscription.
Get Server Glance
for Mac
Free to start on the Mac App Store — monitor 2 servers for free, unlock unlimited with a one-time $19.99 purchase. No subscription.
Also available for iOS & Android